Heater Control based on energy price
Just recently completed a proof of concept regarding controlling the heater system in my house based on current energy prices and will let you know basically how I implemented it.
What I had before starting the work was an IoT-platform very much similar to MING.
Since I am buying my energy based on hourly price fom Tibber I am also provided a web api from their website. And based on this I created this data source:

By running some math on the array of data I have detected tops and valleys.
All values above 90-percentile are also considered tops.
All values below 10-percentile are also considered valleys.
The control program will try to heat my house (more than usual) during the valleys, and in the opposite, try NOT to heat my house during the tops.
The hardware I chose to control the heater with was the very simple Shelly Uni which I have used for other use-cases before with very good results.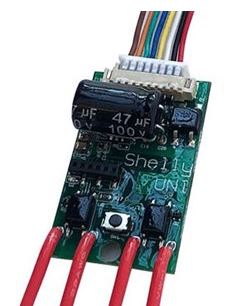
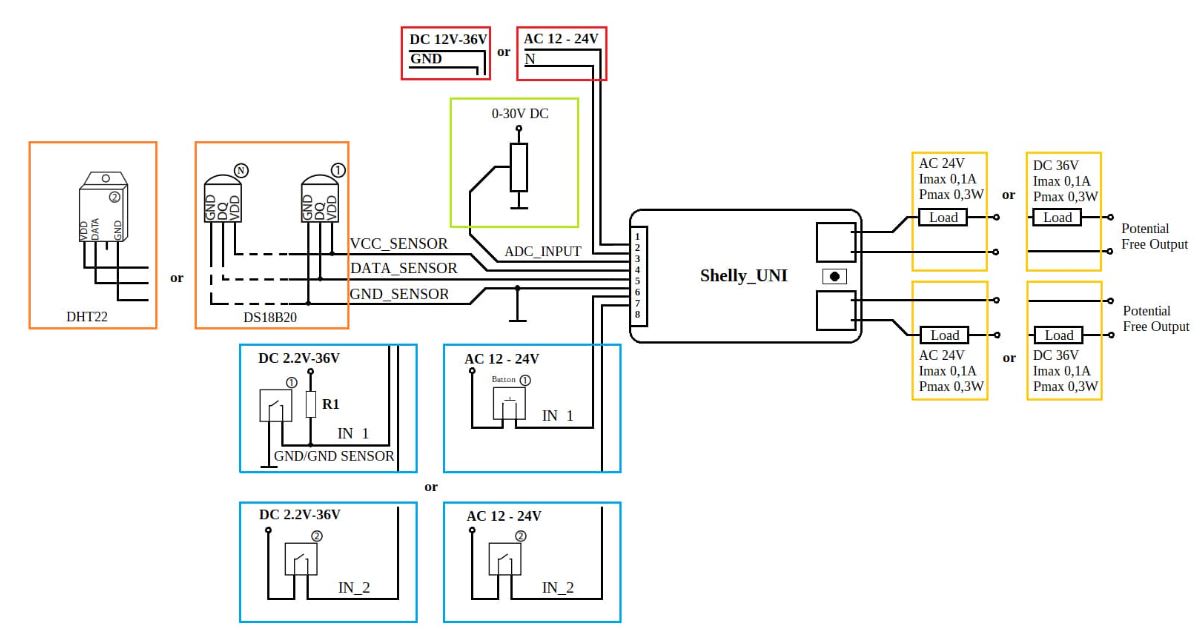
The device has two outputs where I utilized
* output 1 for a serial circuit which will be used to increase the resistance in the outdoor temperature sensor in my heater
* output 2 for a parallel circuit which will be used to decrease the resistance of my outdoor temperature sensor in my heater
As a starting point I added a 20kOhm resistor in my serial circuit and a 4,7kOhm resistor in the parallel circuit.
After a few tests I found that it caused my heater to see an outdoor temperature of roughly 6 degrees celsius below the current temperature if the serial circuit was implemented, and 69 degrees celsius outdoor temperature of the parallel circuit was implemented.
The 4.7kOhm resistor should probably be increased to something like 20kOhm instead to get normal outdoor temperatures. But the heater did not send any alerts so I will deal with that later on.
I put everything together in a nice plasting box and the end result looks like this: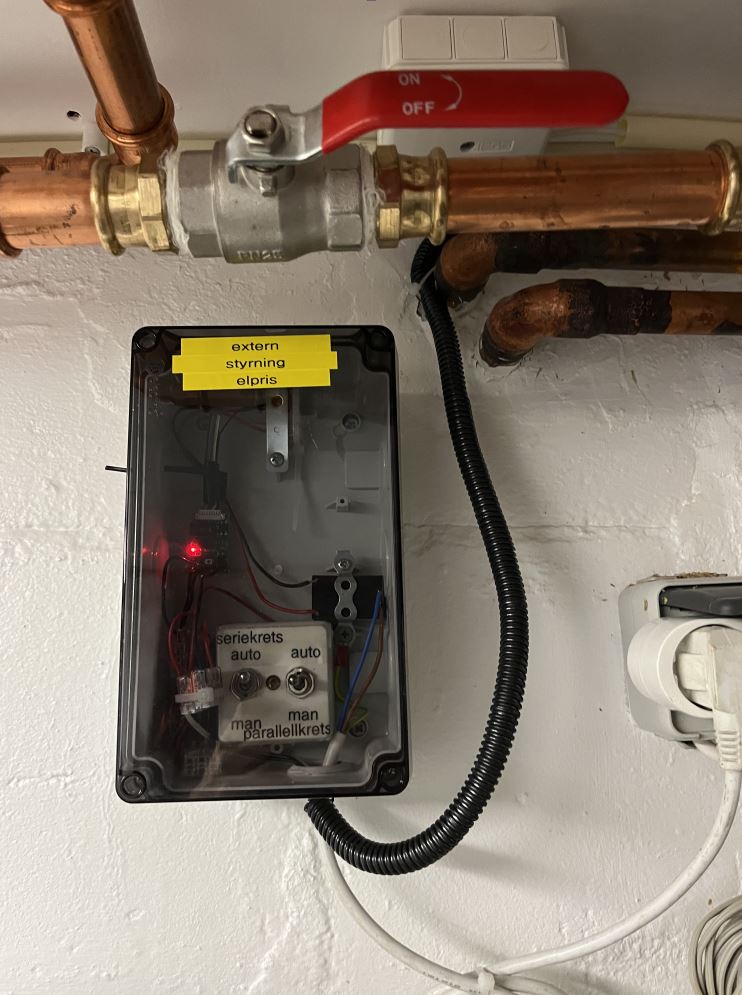
The system has now been running for roughly a day and seems to be working good. It's too soon to measure any gains from it. But I will monitor and hopefully come back with some graphs once I can see the benefits in the data.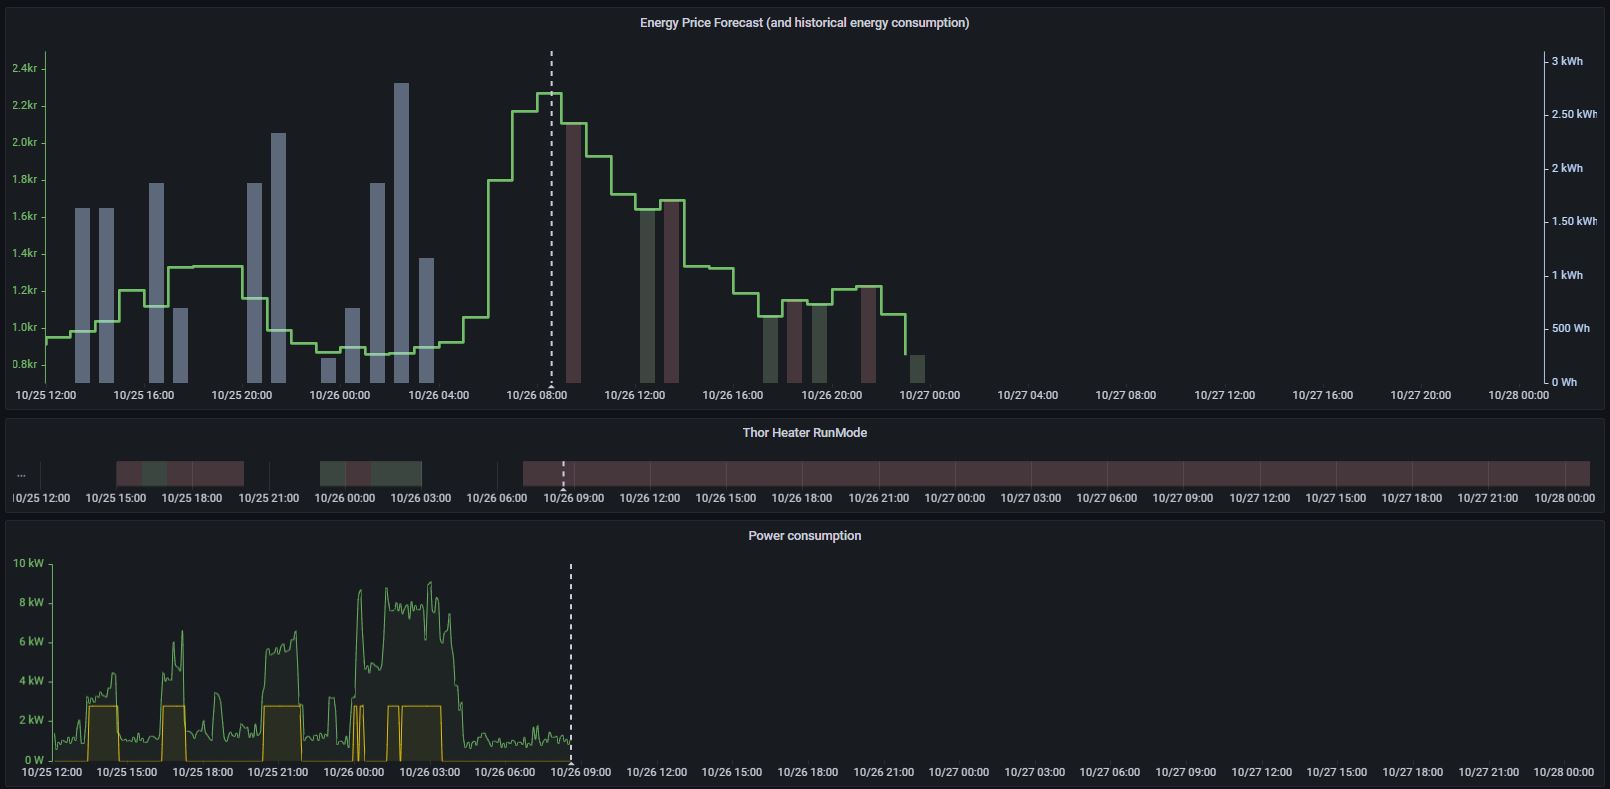
The graph above shows historical energy consumption to the left of the dashed line, and the price forecast to the right of the dashed line.
Tops and valleys are currently only presented on the forecast (right side) so that the blue bars (left side) represents the actual energy consumption from the heater.
The heater equipment is not only heating the house, it is also heating the shower water.
This control program does not affect the shower water, only the water sent to radiators. Because of this, there is still some energy consumption showing up in the graph even though there is a high price identified.
I can also mention, the yellow line in the bottom representing the power consumption from the heater is created virtually becuase there is no dedicated measuring of the equipment. In reality, the line would have much more noise.
Update 2022-11-16
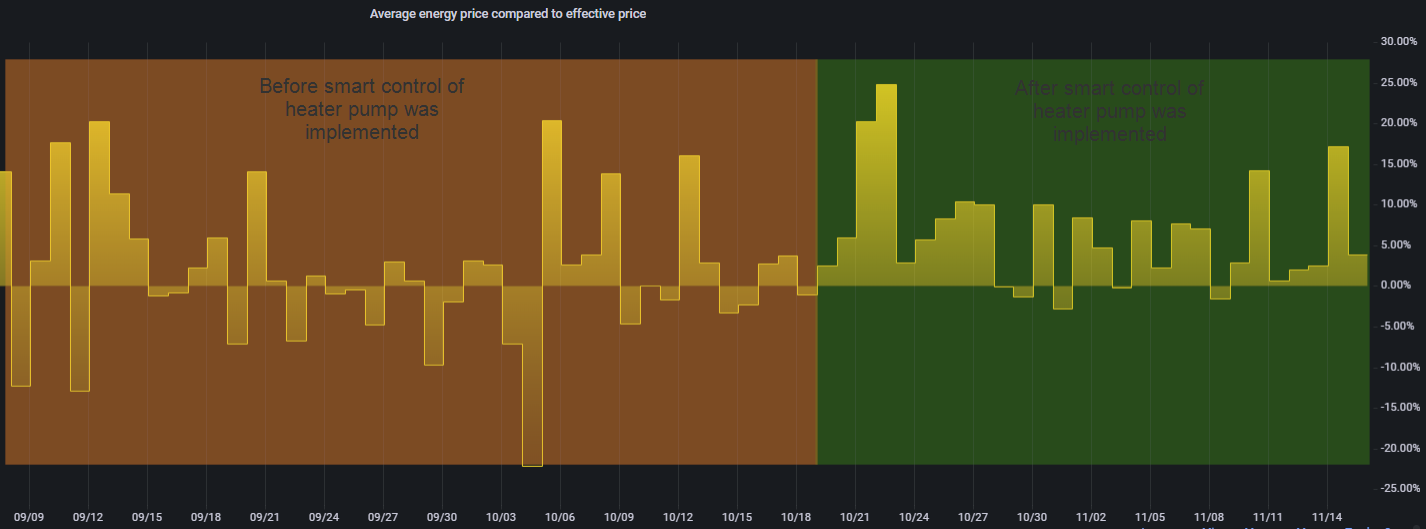
After running this solution now for a while, I looked back at the data and could see huge improvements regarding the efficiency of running hourly pricing now that the heater pump is controlled in a smarter way.
On the left side (orange) before the smart control was implemented.
On the right side (green) after the smart control was implemented.
Notice that the percentage gain is now pretty much positive every day, compared to before when the gain was always centered around 0 percentage.
There is still some days when the gain has been negative and I will try to tweak the logic slightly to see if this can be removed.
The main reason why this happens some days is because the smart control only applies to the radiator heating, not the warm water used for showering. But the measured energy consumption includes both scenarios. And if we are unlucky, someone in the family might take a long shower just before the energy price in in a daily peek and I am not planning to prevent this from happening.
energy, smart-home, shelly uni, heater
- Träffar: 2166