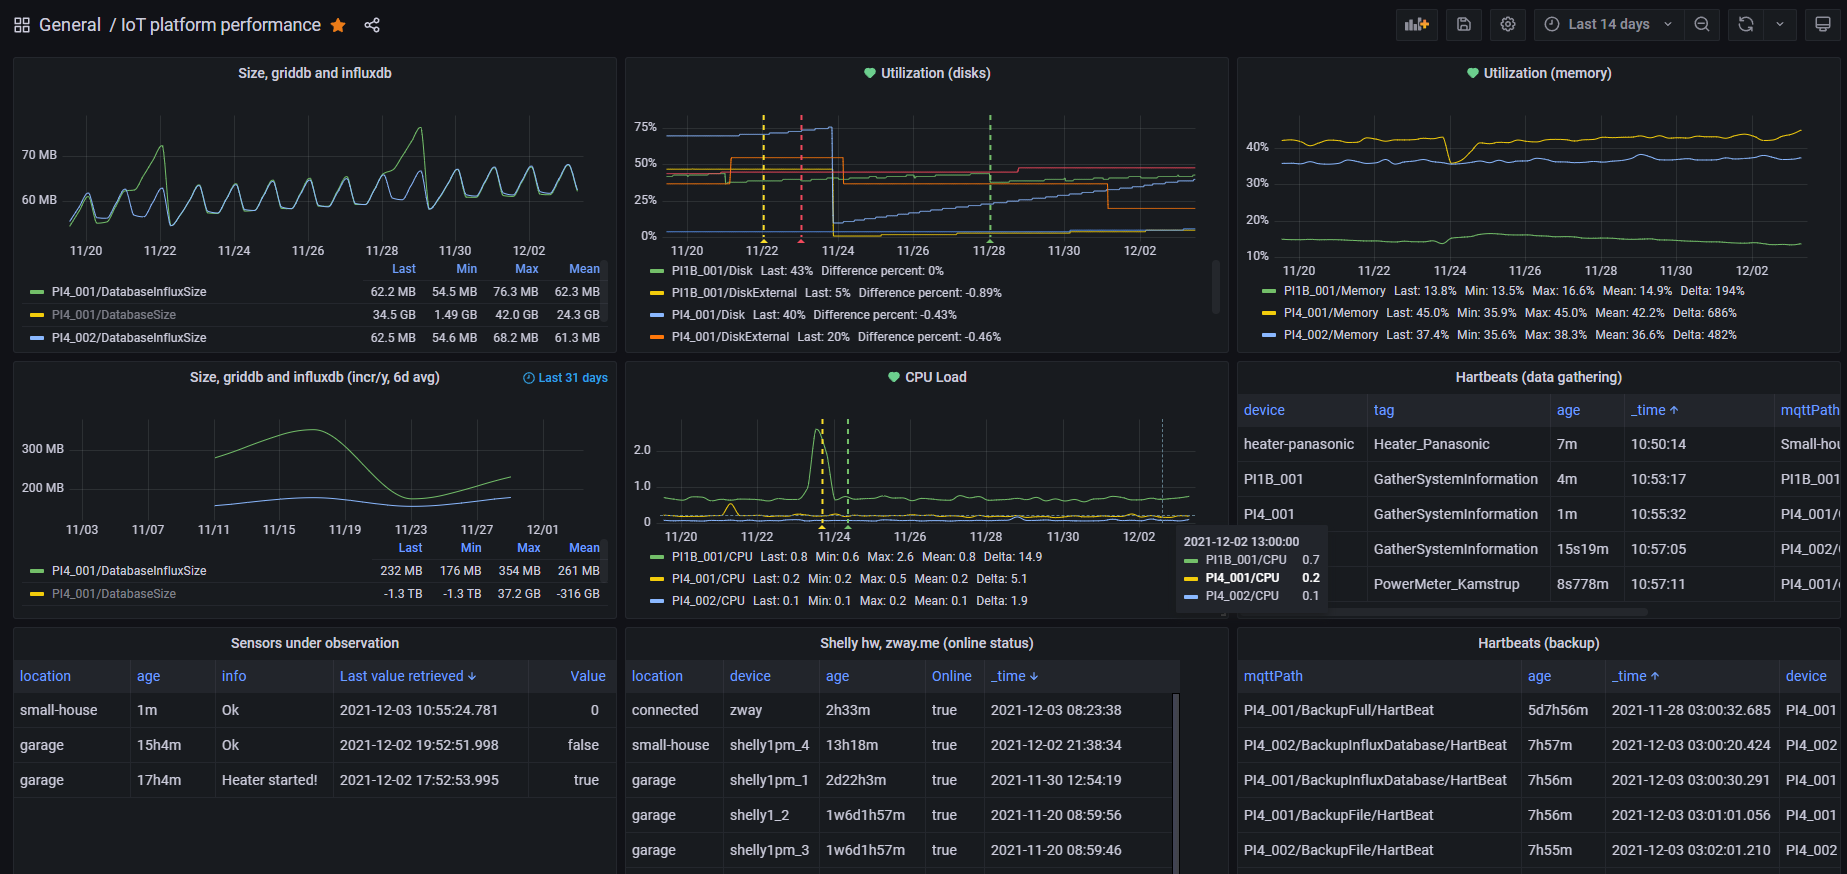
Jag erbjuder en egenutvecklad IoT-plattform som specifikt inriktar sig på uppföljning av elförbrukning där anläggningen kan bestå av många el-centraler.
Men plattformen är flexibel och kan hantera övriga sensorer inom IoT (temperatur, fukt, belysning).
I en industri med många stora elförbrukare kan det vara väldigt svårt att få förståelse för vilka förbrukare som står för den stora energiförbrukningen.
Det kan också vara så att industrin ibland befinner sig i ett läge då allt start upp samtidigt och orsakar att månadens effekttariff blir extremt hög.
Genom att mäta energiförbrukningen på resp. fas i alla el-centraler (och ev. direkt på enskilda apparater) så kan detta relativt enkelt visualiseras och förebyggas.
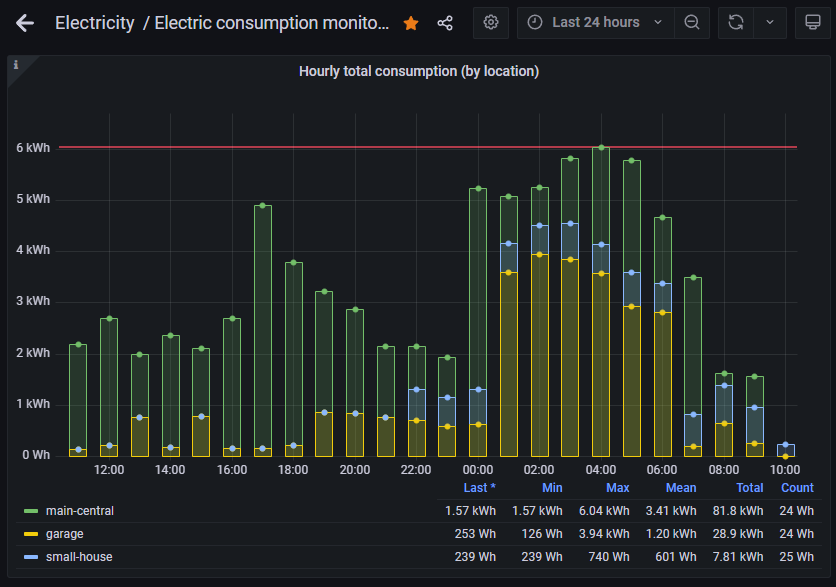
Ett exempel på hur uppföljning på timmesnivå kan se ut, se bilden nedan.
- main-central läses med MBUS direkt på leverantörens el-central (Kamstrup).
- garage läses med en 3-fas Power Meter från shelly (max 120A per fas) (ca. 1400kr per central).
- small-house läses med en 1-fas Power Meter från shelly (max 3500W) (200kr per mätpunkt).
Plattformen kan köras på Raspberry PI 4 och kan därför byggas till en mycket låg kostnad (ca. 1000kr hårdvara).
Du är välkommen att kontakta mig så kan vi diskutera hur en ev. lösning skulle kunna se ut och kosta för er anläggning.
New Heater control system based on electricity price
Okay let's get your updated on the latest solution.
Hardware
What I had before in terms of hardware (shelly uni) worked pretty good. Really nothing to complain about the solution, but I discovered how to enable MODBUS TCP in the heater and started looking into this more.
A few days later I was able to remove the external hardware I built controlling the heater and now running the control program completely from software using purely modbus communication.
The software communication is utilizing Home Assistant Modbus integration and only requiered me to figure out which address each parameter in the heater had. This was a pretty touch job.
Mainly what I did was
• installing CAS Modubus Scanner on my PC
• ran remote desktop from my Chrome-book to the PC with the modbus scanner
• and was then able to look at all modbus parameters live while comparing the numbers on the heater display. And then wrote down all the addresses I was interesting in.
Basically, below you'll see the sensors I was able to locate modbus addresses for
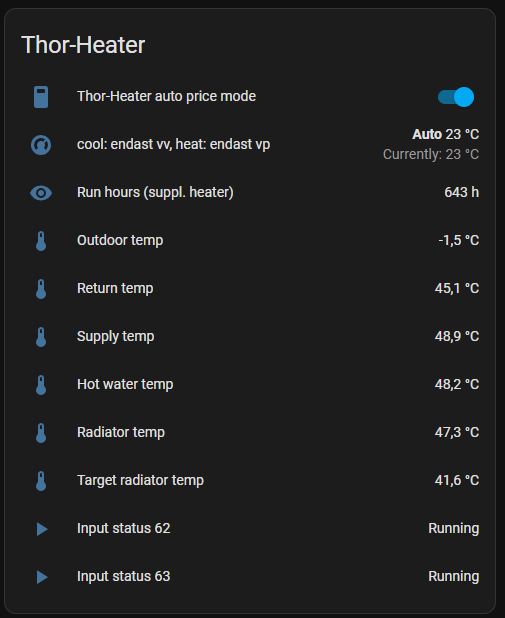
First line is an internal home-assistant switch which will allow me to disable/enable the control program if anything starts to malfunction. But the other signals are pulled directly from the heater.
The last two signals indicates if the heater is in running state or not. One of them could be removed, they are always showing the same state.
The signals are then pulled from Home Assistant into my node-red software using the Home-Assistant plugin for node-red. This is then where the logic is applied.
Control program
I have also added some more math into the control program to make it more dynamic.
There are a few questions that will need to be answered to make all the right decisions in the control program.
- What will be the out door temperature for the next hours?
I am currently using the SMHI web api to fetch this information.
- How many hours will my heater need to run based on the temperature forecast fetched above?
I use run history from my house to fetch this information. As seen in the graph the number of run hours on my heater is forming a pretty linear function.
Using what we learned in school back in the days about linear functions I was able to figure out a function describing the run hours based on the out-door temperature.
Now with knowledge about the required run hours on my heater each day I can schedule the downtime based on the coming price tops.

In the image above you'll see red bars indicating total downtime on the heater.
And as you may also see there are always one hour indicated with green color infront of each red bar. This will ask the heater to run the hour before the scheduled downtime ans avoid too low temperature in the radiator tanks.
The yellow line indicates the price limit that will need to be accepted this specific period to avoid the heater from getting less run hours than needed. So based on the out-door temperature the heater could be running all hours where price is less than the yellow line and then is not needed the other hours.
The problem with this is that the radiator tank cannot store this amount of heat and so will still require the heater to start during the time when price to above line.
What I did instead is that I scheduled the downtime around all the tops instead and have set limit on how many hours each downtime can go on in percentage of the total downtime. And from what I can see now the solution works well.
Only problem I sometimes can see is that when the temperature is very low (below -20C) the temperature in the garage is hard to maintain and I cannot afford scheduling any downtime at all without getting affected by low inside temperature.
When looking back at the history I can clearly see that the control program is doing what it is supposed to but I can also see that there is a very little earning that can be made on the heater because it cannot be scheduled on downtime for a very long time and only the biggest price tops during each days is what you can earn from.

We can see that most of the days we have roughly 2-5% earning from the heater running this way. It's not very much but having a program doing this won't cost me anything more than the spent hours so far.
energiförbukning, elförbrukning, energipris, timmespris, smart-home, modbus
- Träffar: 1599
Heater Control based on energy price
Just recently completed a proof of concept regarding controlling the heater system in my house based on current energy prices and will let you know basically how I implemented it.
What I had before starting the work was an IoT-platform very much similar to MING.
Since I am buying my energy based on hourly price fom Tibber I am also provided a web api from their website. And based on this I created this data source:

By running some math on the array of data I have detected tops and valleys.
All values above 90-percentile are also considered tops.
All values below 10-percentile are also considered valleys.
The control program will try to heat my house (more than usual) during the valleys, and in the opposite, try NOT to heat my house during the tops.
The hardware I chose to control the heater with was the very simple Shelly Uni which I have used for other use-cases before with very good results.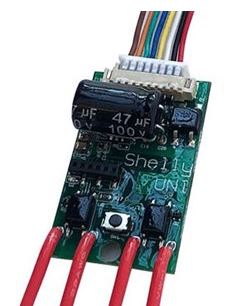
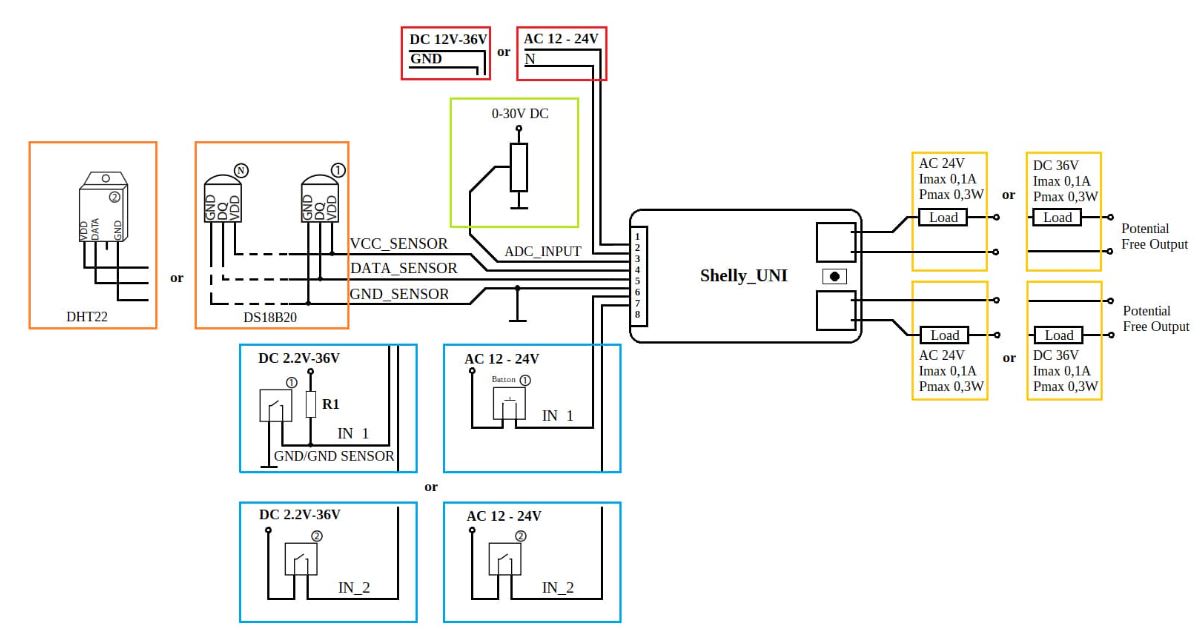
The device has two outputs where I utilized
* output 1 for a serial circuit which will be used to increase the resistance in the outdoor temperature sensor in my heater
* output 2 for a parallel circuit which will be used to decrease the resistance of my outdoor temperature sensor in my heater
As a starting point I added a 20kOhm resistor in my serial circuit and a 4,7kOhm resistor in the parallel circuit.
After a few tests I found that it caused my heater to see an outdoor temperature of roughly 6 degrees celsius below the current temperature if the serial circuit was implemented, and 69 degrees celsius outdoor temperature of the parallel circuit was implemented.
The 4.7kOhm resistor should probably be increased to something like 20kOhm instead to get normal outdoor temperatures. But the heater did not send any alerts so I will deal with that later on.
I put everything together in a nice plasting box and the end result looks like this: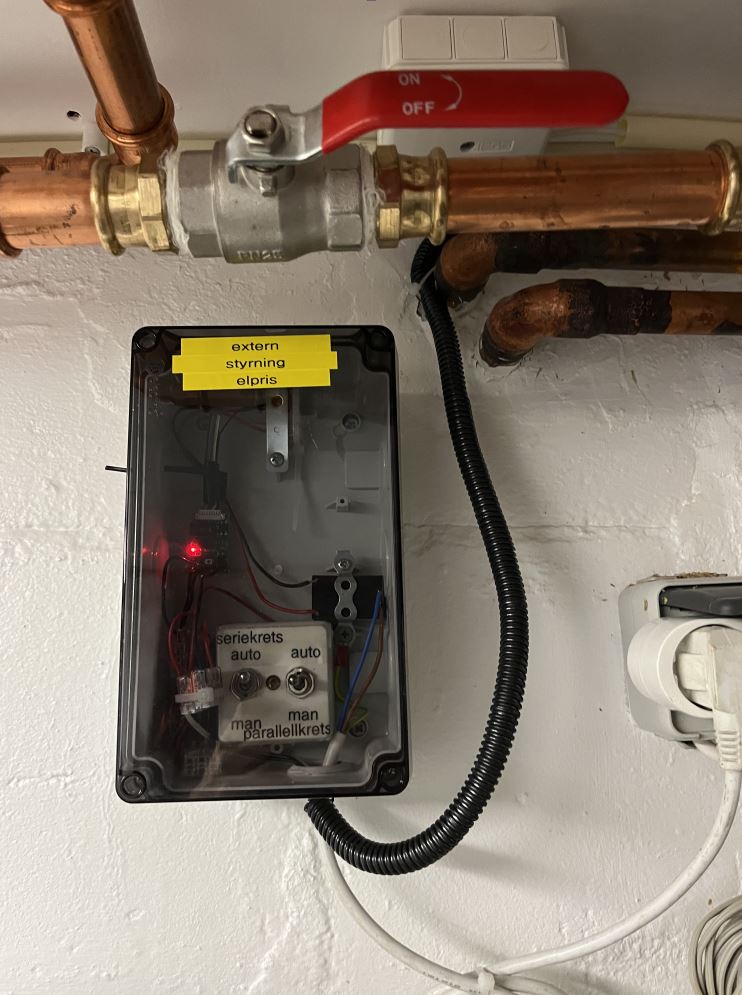
The system has now been running for roughly a day and seems to be working good. It's too soon to measure any gains from it. But I will monitor and hopefully come back with some graphs once I can see the benefits in the data.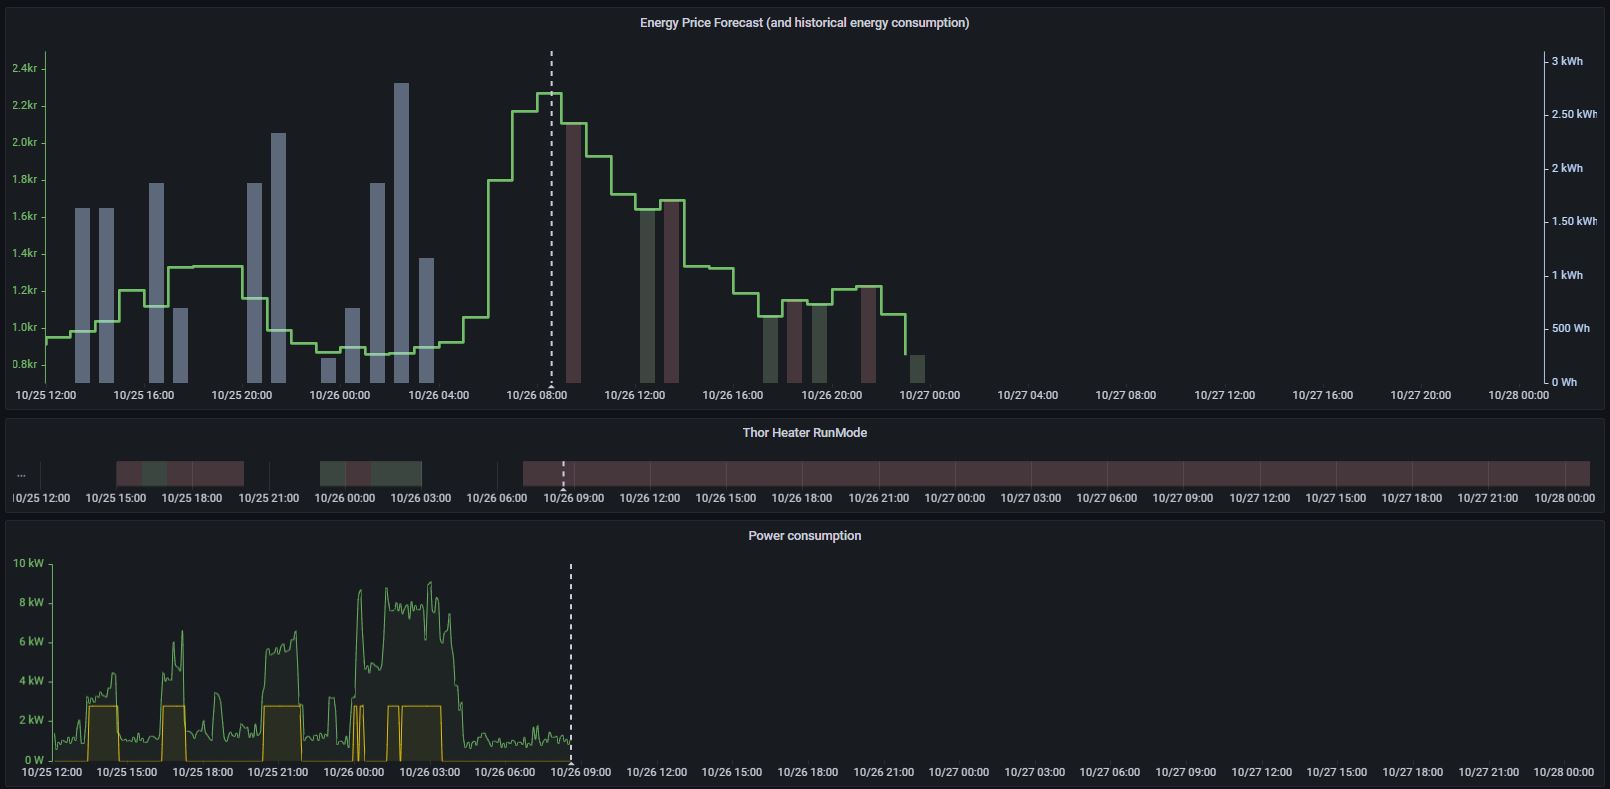
The graph above shows historical energy consumption to the left of the dashed line, and the price forecast to the right of the dashed line.
Tops and valleys are currently only presented on the forecast (right side) so that the blue bars (left side) represents the actual energy consumption from the heater.
The heater equipment is not only heating the house, it is also heating the shower water.
This control program does not affect the shower water, only the water sent to radiators. Because of this, there is still some energy consumption showing up in the graph even though there is a high price identified.
I can also mention, the yellow line in the bottom representing the power consumption from the heater is created virtually becuase there is no dedicated measuring of the equipment. In reality, the line would have much more noise.
Update 2022-11-16
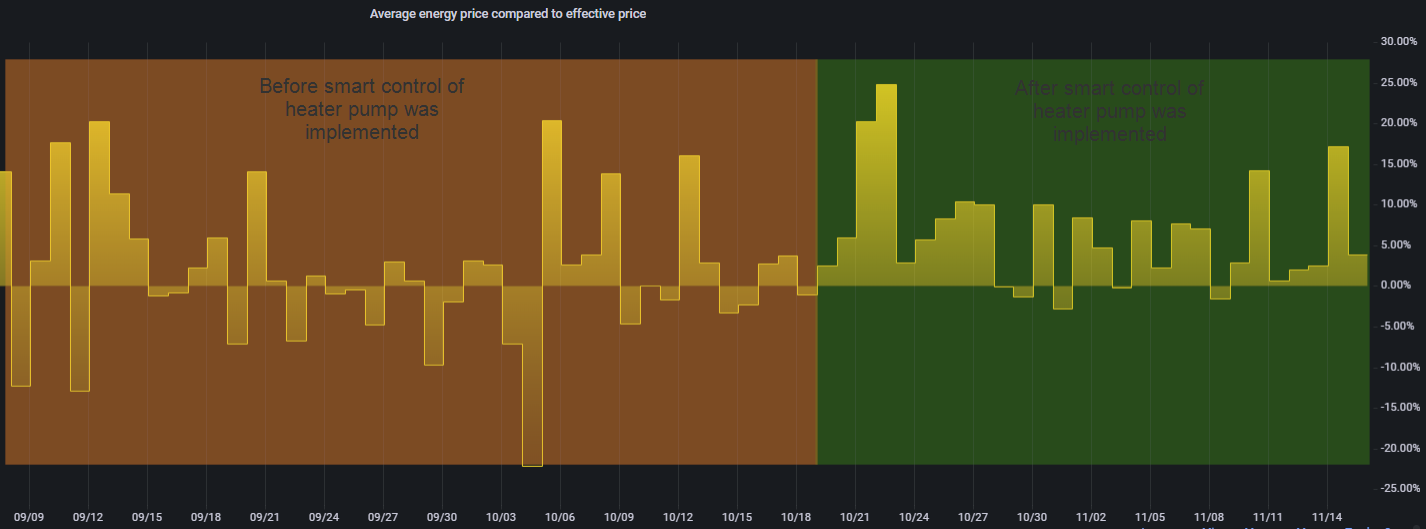
After running this solution now for a while, I looked back at the data and could see huge improvements regarding the efficiency of running hourly pricing now that the heater pump is controlled in a smarter way.
On the left side (orange) before the smart control was implemented.
On the right side (green) after the smart control was implemented.
Notice that the percentage gain is now pretty much positive every day, compared to before when the gain was always centered around 0 percentage.
There is still some days when the gain has been negative and I will try to tweak the logic slightly to see if this can be removed.
The main reason why this happens some days is because the smart control only applies to the radiator heating, not the warm water used for showering. But the measured energy consumption includes both scenarios. And if we are unlucky, someone in the family might take a long shower just before the energy price in in a daily peek and I am not planning to prevent this from happening.
energy, smart-home, shelly uni, heater
- Träffar: 2219
Vad tjänar man på timmespris?
Om man köper sin energi på spotpris per timme så kan man så klart får ner sin effektiva energikostnad genom att använda energin på ett klokt sätt. Att använda energin klokt är egentligen inte är svårare än att man använder mer energi när priset är lågt än de timmar då priset är högt.
Kan man automatisera detta så är det inte heller någon ansträngning (om man bortser från investering i automation).
Men hur mycket förtjänst genererar det i praktiken kan man ju undra?
Jag har gjort en enkel analys om hur många procent jag tjänar in på elkostnaden per dygn i jämförelse med om jag skulle betala medelpriset för dygnet istället för priset för varje enskild timme.
Ser man på hela hushållets förbrukning så ligger medlet för senaste 14 dagarna på strax under +8% förtjänst som det ser ut idag.
Men för elbilsladdningen ligger medlet för samma period på +55%, värmepumpen på -0,4%.
Elbilsladdningen styr jag själv genom att noggrant följa priset, medan värmepumpen går helt själv och arbetar när värmen behövs oavsett priset på energin.
Skulle jag ha förutsättningar för att styra även värmepumpen på ett klokt sätt så finns det helt klart stora frutsättningar för att kunna sänka priset på energin. Detta är nästa steg jag har för avsikt att jobba med. Kanske kommer en uppdatering när jag har data att utvärdera.
När det gäller rena pengar rör det sig, på laddningen av bilen, om 60kr förtjänst med en kostnad på 80kr istället för 140kr för senaste två veckornas bilkörning.
I grafen nedan kan man utläsa procentuella förtjänsten på timmespris kontra dygnsmedelpris för
- lila = elbilsladdningen
- gul = värmepump
- orange = hela hushålet

Man kan även jämföra det effektiva timpriset där man tydligt ser att timmepriset sjunker rejält när bilen laddas klokt.
Men man ser även ett dygn där priset legat över dygnsmedelpris eftersom bilen laddats på en dålig tidspunkt.
lila = elbilsladdning
röd = dygnsmedelpris (spotmarknad)

energiförbrukning, energipris, timmespris
- Träffar: 1459
Behöver du koll på din elförbrukning?
Till privatpersoner och framför allt större företag med många elcentraler som har problem att förstå var elen tar vägen och behöver en analysplattform för att visualicera detta på en enkelt sätt så kan jag nu offerera en lösning som nog kan passa er.
Bilder:

Kontakta mig här Henrik Nordling.
- Träffar: 1741
Accelev v2 Control program
Just recently completed the control program for the Accelev v2 2 phase EV charger.
The charger can transform 400V 2 phase down to 250V 1 phase which comes handy for cars that are equiped with only 1 phase on-board charger.
The technique utilized are an IoT platform running on a raspberry pi 4, running ubuntu 20.04 LTS.
Influxdb v2 as database, recording everything passing the mqtt broker on localhost.
Grafana for graphs.
Node-RED for flow control (this is currently where the program is running).
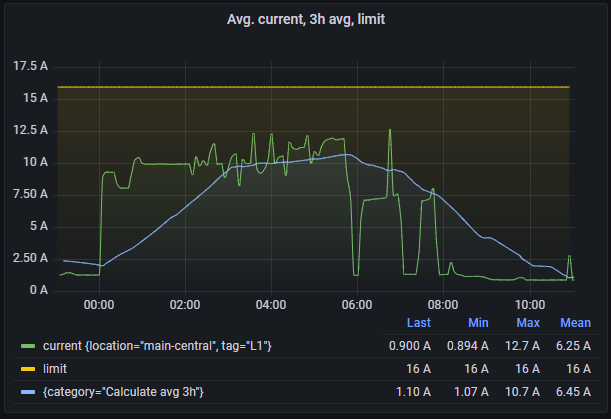
And as you can see in the image below, the current in main central i pretty close to the fuse limit throughout the charging time.
The three graphs in the top represents the current in the main central.
The three graphs in the bottom represents the current in the garage (where the charger is located).

The charger does not yet allow to communicate directly with the control program, it requiers connection with the server over internet and therefore won't work without internet connection.
From what I've heard, the vendor are working on implmentation of the apis directly in the local charger.
- Träffar: 2385
Fler artiklar …
Sida 1 av 2